Exploring #BlackLivesMatter in 5 Charts
Since George Floyd’s killing on May 25th 2020, we have seen an outpouring of anger at the treatment of Black people at the hands of police, and, more widely, at the racial injustices across society.
This problem isn’t a new one, and it won’t be solved overnight. Many people have been campaigning and talking about these issues using data for a long time, but it seems that finally people who have been apathetic, including myself, are now confronting the issue.
Data, used correctly, can be a tool for change in this fight. The charts below don’t tell new stories; you may have seen or heard the statistics in them many times before, but they are important stories. Nor do the charts below attempt to tell the whole story, there are many facets to each of the pictures painted here, and many other stories that need to be told over the coming months and years.
I appreciate that people of colour have told, retold and campaigned for around this subject for years — as a White man, I will never be able to speak to their experiences. This post is from a place of learning, educating and addressing this important issue through a lens familiar to me; data.
The data we explore in the charts below is not pleasant, many talk about death resulting from racial inequality, bias and racism. However, we need to start somewhere and so we need to put George Floyd’s death in context.
Police Shootings in the US
Lethal force in the US goes well beyond shootings, as George Floyd’s death has shown. However, historically data on lethal force by the police has not been gathered consistently to allow simple research. Some organisations and newspapers have stepped in to collect data in this dearth of reliable information.
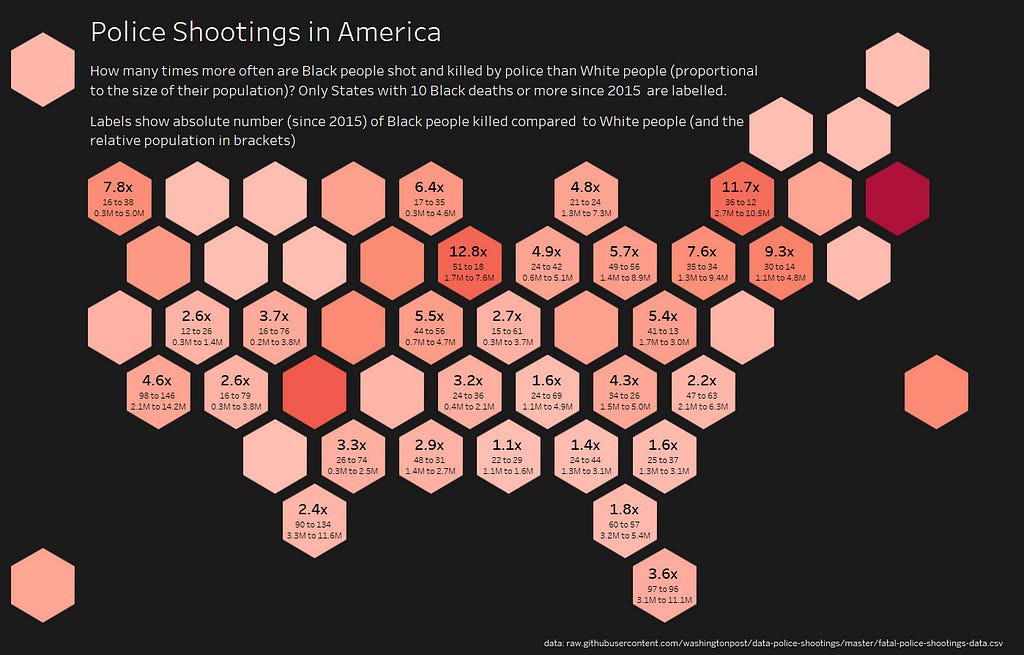
Analysing data collected by the Washington Post on police shootings from 2015 and looking at the race of those killed it is clear the US has a problem.
Further Reading:
Risk of being killed by police use of force in the United States by age, race-ethnicity, and sex https://www.pnas.org/content/116/34/16793
Mapping Police Violence https://mappingpoliceviolence.org/
What the data say about police shootings https://www.nature.com/articles/d41586-019-02601-9
Prison
Sentencing policies such as the “three strikes” policy, as well as tough sentencing on offences involving crack cocaine, led to an explosion in the prison population in the ’80s and ‘90s.
The USA has the highest rate of incarceration in the world. 1 in 5 prisoners worldwide are imprisoned in the US*.
*according to data from World Prison Brief, Institute for Crime & Justice Policy Research (https://www.prisonstudies.org/highest-to-lowest/prison-population-total). Underlying sources for this data differ in recency, and accuracy can be difficult due to differences in reporting between countries but the 1 in 5 number remains broadly indicative.
Furthermore, in part due to these policies, proportionally many more Black people are imprisoned in the US than White people. A discrepancy that, in the 2016 data below, gives rise to proportionally over 10x more Black people being imprisoned than White people in five US States. Universally in the data, we see Black people incarcerated at a higher rate.
Further Reading:
The Color of Justice: Racial and Ethnic Disparity in State Prisons https://www.sentencingproject.org/publications/color-of-justice-racial-and-ethnic-disparity-in-state-prisons/
Criminal Justice Factsheet (NAACP) https://www.naacp.org/criminal-justice-fact-sheet/
13th https://www.netflix.com/gb/title/80091741
The color of punishment: African Americans, skin tone, and the criminal justice system https://www.tandfonline.com/doi/abs/10.1080/01419870.2018.1508736?journalCode=rers20
In our backyards: Ending Mass Incarceration Where It Begins https://www.vera.org/in-our-backyards
Out of Sight: The Growth of Jails in Rural America https://www.vera.org/publications/out-of-sight-growth-of-jails-rural-america
The New Dynamics of Mass Incarceration: https://www.vera.org/publications/the-new-dynamics-of-mass-incarceration
Incarceration in Local Jails and State Prisons: https://www.vera.org/publications/state-incarceration-trends
Voting Rights
The incarceration of Black people has a serious effect on voting rights too. With many States having policies that remove the rights of prisoners and ex-prisoners to vote many Black people are prevented from voting. Across the USA one in thirteen Black people are disenfranchised in this manner, and in States like Kentucky (1 in 4) or Florida (1 in 5), the rate is much higher.
[Terminology note: The visualisation below uses African American as opposed to Black as this term was used in the original data source]
Further Reading:
6 Million Lost Voters: State-Level Estimates of Felony Disenfranchisement, 2016 https://www.tandfonline.com/doi/abs/10.1080/01419870.2018.1508736?journalCode=rers20
Voter Suppression Is Warping Democracy https://www.theatlantic.com/politics/archive/2018/07/poll-prri-voter-suppression/565355/
Beyond Crime
It is easy, given the Black Lives Matters movement, and its prominence, to not look wider than stories involving crime and police. However, bias and inequality can be found in many places.
Should we expect, in the 21st Century, in the US, for Black women to be dying in pregnancy at a higher rate than their White compatriots? Shockingly, that is what studies show:
Further Reading:
Racial/Ethnic Disparities in Pregnancy-Related Deaths — United States, 2007–2016 https://www.cdc.gov/mmwr/volumes/68/wr/mm6835a3.htm?s_cid=mm6835a3_w
Maternal mortality in America, in 3 charts https://www.advisory.com/daily-briefing/2019/10/08/maternal-mortality
Beyond the US
Nor is racism, bias and inequality an issue in just the US.
The chart below shows arrest rates in England and Wales, demonstrating that some areas have 12x more Black people arrested (proportional to the Black population in those areas) than White people.
Further Reading:
UK Arrests Facts and Figures: https://www.ethnicity-facts-figures.service.gov.uk/crime-justice-and-the-law/policing/number-of-arrests/latest
The Colour of Injustice: ‘Race’, drugs and law enforcement in England and Wales: https://www.release.org.uk/publications/ColourOfInjustice
#BlackLivesMatter
Ways you can help:
much has been written on this subject already, see https://www.timeout.com/things-to-do/how-to-support-black-lives-matter for example
follow, listen and elevate Black voices in Data and Data Science on Twitter: https://twitter.com/i/lists/912068611644280832
research, watch and read, create data visualisations to discuss the stories you find: https://medium.com/nightingale/data-visualization-racism-a4521a1864d1
do all the above, in a month, in a year, in five years. Don’t let the momentum stop as the noise dies down.
Special thanks to Amanda Makulec, Kofi Bonsu, Ravi Mistry, soha elghany and Steve Wexler — Data Revelations for their help, input and feedback on this article.


